
What Are Stylized Facts?
In financial markets, no matter where or when you look — equities, commodities, or cryptocurrencies — certain data behaviors consistently appear. These are called Stylized Facts: empirical, observed characteristics of financial time series that are remarkably universal across instruments, time frames, and geographies.
Why They Matter
These facts reveal how real market data deviates from classical assumptions like “returns are independent and normally distributed.” Understanding these patterns helps quants and portfolio managers build better models that are robust, adaptive, and risk-aware.
Stylized Facts — Explained with Data
Let’s see what these stylized facts look like in actual historical market data.
We’ve divided the market data into 4 periods and computed Skewness and Kurtosis, two measures that capture asymmetry and tail risk in returns distributions — key stylized facts.
Period-Wise Analysis (NIFTY 50)
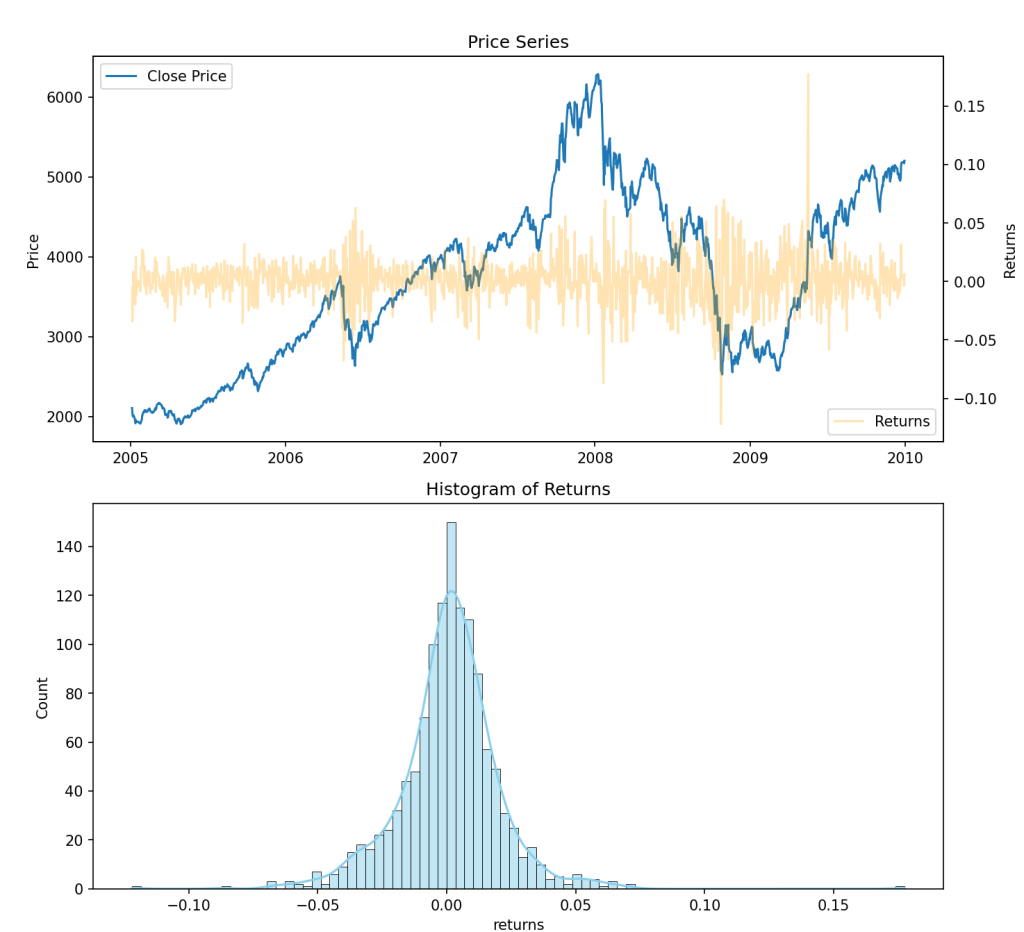
2005–2009: Financial Crisis Era
📈 Skewness: +0.227 | Kurtosis: 7.724
→ Heavy tails, frequent extreme moves
Observation:
- Price series shows strong upward and downward moves (2008 crash visible).
- Return histogram is sharply peaked with fat tails, confirming heavy-tailed behavior (kurtosis > 3).
2010–2014: Post-Crisis Stabilization
📈 Skewness: +0.009 | Kurtosis: 0.895
→ Mildly normal-like returns
Observation:
- Markets stabilized, fewer extreme moves.
- Return histogram is more bell-shaped, with thinner tails compared to crisis years.

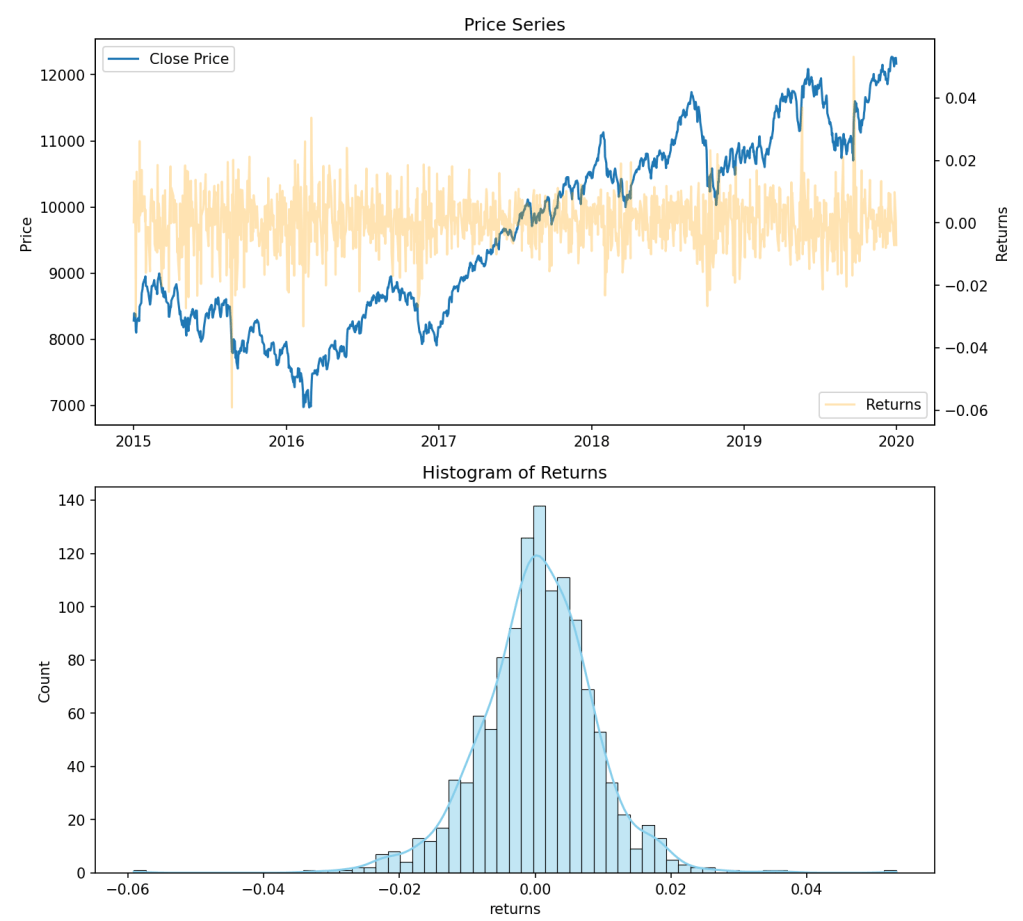
2015–2019: Steady Bull Market
📈 Skewness: -0.187 | Kurtosis: 3.665
→ Slight asymmetry and fat tails
Observation:
- Positive long-term trend with occasional corrections.
- Return distribution becomes slightly negatively skewed, with some fat-tail behavior.
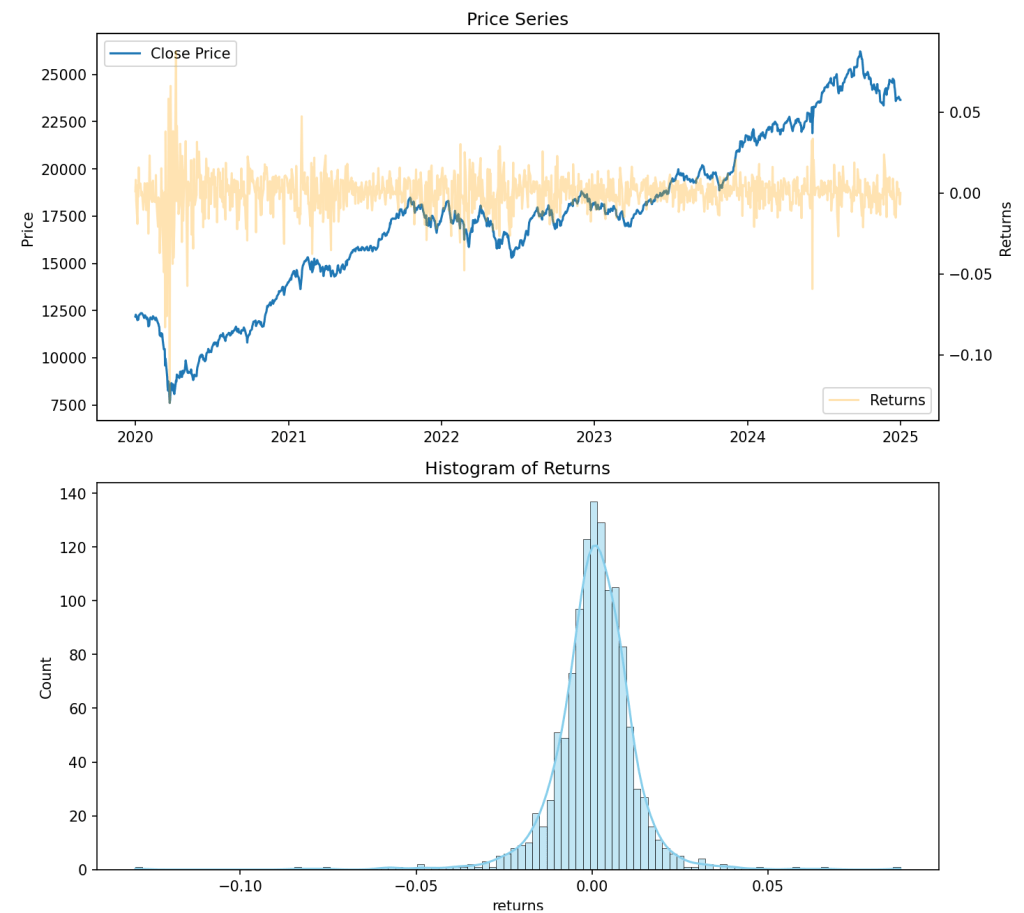
2020–2024: Pandemic & Volatile Recovery
📈 Skewness: -1.399 | Kurtosis: 19.081
→ Extreme asymmetry, huge tail risk
Observation:
- COVID-19 crash and subsequent market surges.
- Return histogram is highly left-skewed with ultra-heavy tails — worst-case stylized fact scenario.
What Problems Do These Stylized Facts Cause?
- Classical models like Mean-Variance Optimization assume normality.
→ In the presence of skewness and fat tails, such models drastically underestimate risk. - Extreme events happen more often than predicted by normal models.
→ This leads to sudden, large losses known as “tail risk”. - Correlations between assets increase during crises.
→ Diversification benefits diminish when they’re needed the most. - Volatility clustering
→ Large moves tend to be followed by large moves, creating persistent high- or low-volatility periods.
How Quants & Portfolios Tackle This
- Use heavy-tailed distributions (like Student-t) instead of Gaussian models.
- Incorporate volatility clustering with GARCH, Stochastic Volatility models.
- Adopt robust optimization, drawdown constraints, and tail-risk measures like CVaR.
- Use dynamic, data-driven correlations (e.g., DCC models, financial graphs).
